What is the HangOn Green Effect?
The short answer is: it’s a triple effect that lowers your energy usage, lowers your CO2 footprint and gives you a higher profit in your coating line. On this page, we will explain how you can achieve all these effects with one simple, but smart, solution – Fill the line.
Fill the line – and achieve all 3 effects
Lower Energy
- How to affect your coating line’s energy consumption
- The 3 big losses
- 80-90% of the energy consumption is constant
- How dense hanging makes a difference
- Calculate how much you could save in your own line
Lower CO2
- How big is your CO2 footprint?
- Proton’s revolutionary journey, and how they did it
- The 3 big factors affecting CO2 in a coating line
- Why should we care about CO2?
- How to make your numbers greener
Higher Profit
- How to save money in your production
- Produce twice as much every hour
- Fixed vs. variable costs, and how to make an impact
- The effect of dense hanging
Why did we create the HangOn Green Effect?
Doesn’t HangOn just make hooks and maskings? Why are you talking about energy consumption and CO2 emissions?
Yes, good question! Click on the video to hear all about the story and vision behind the concept.
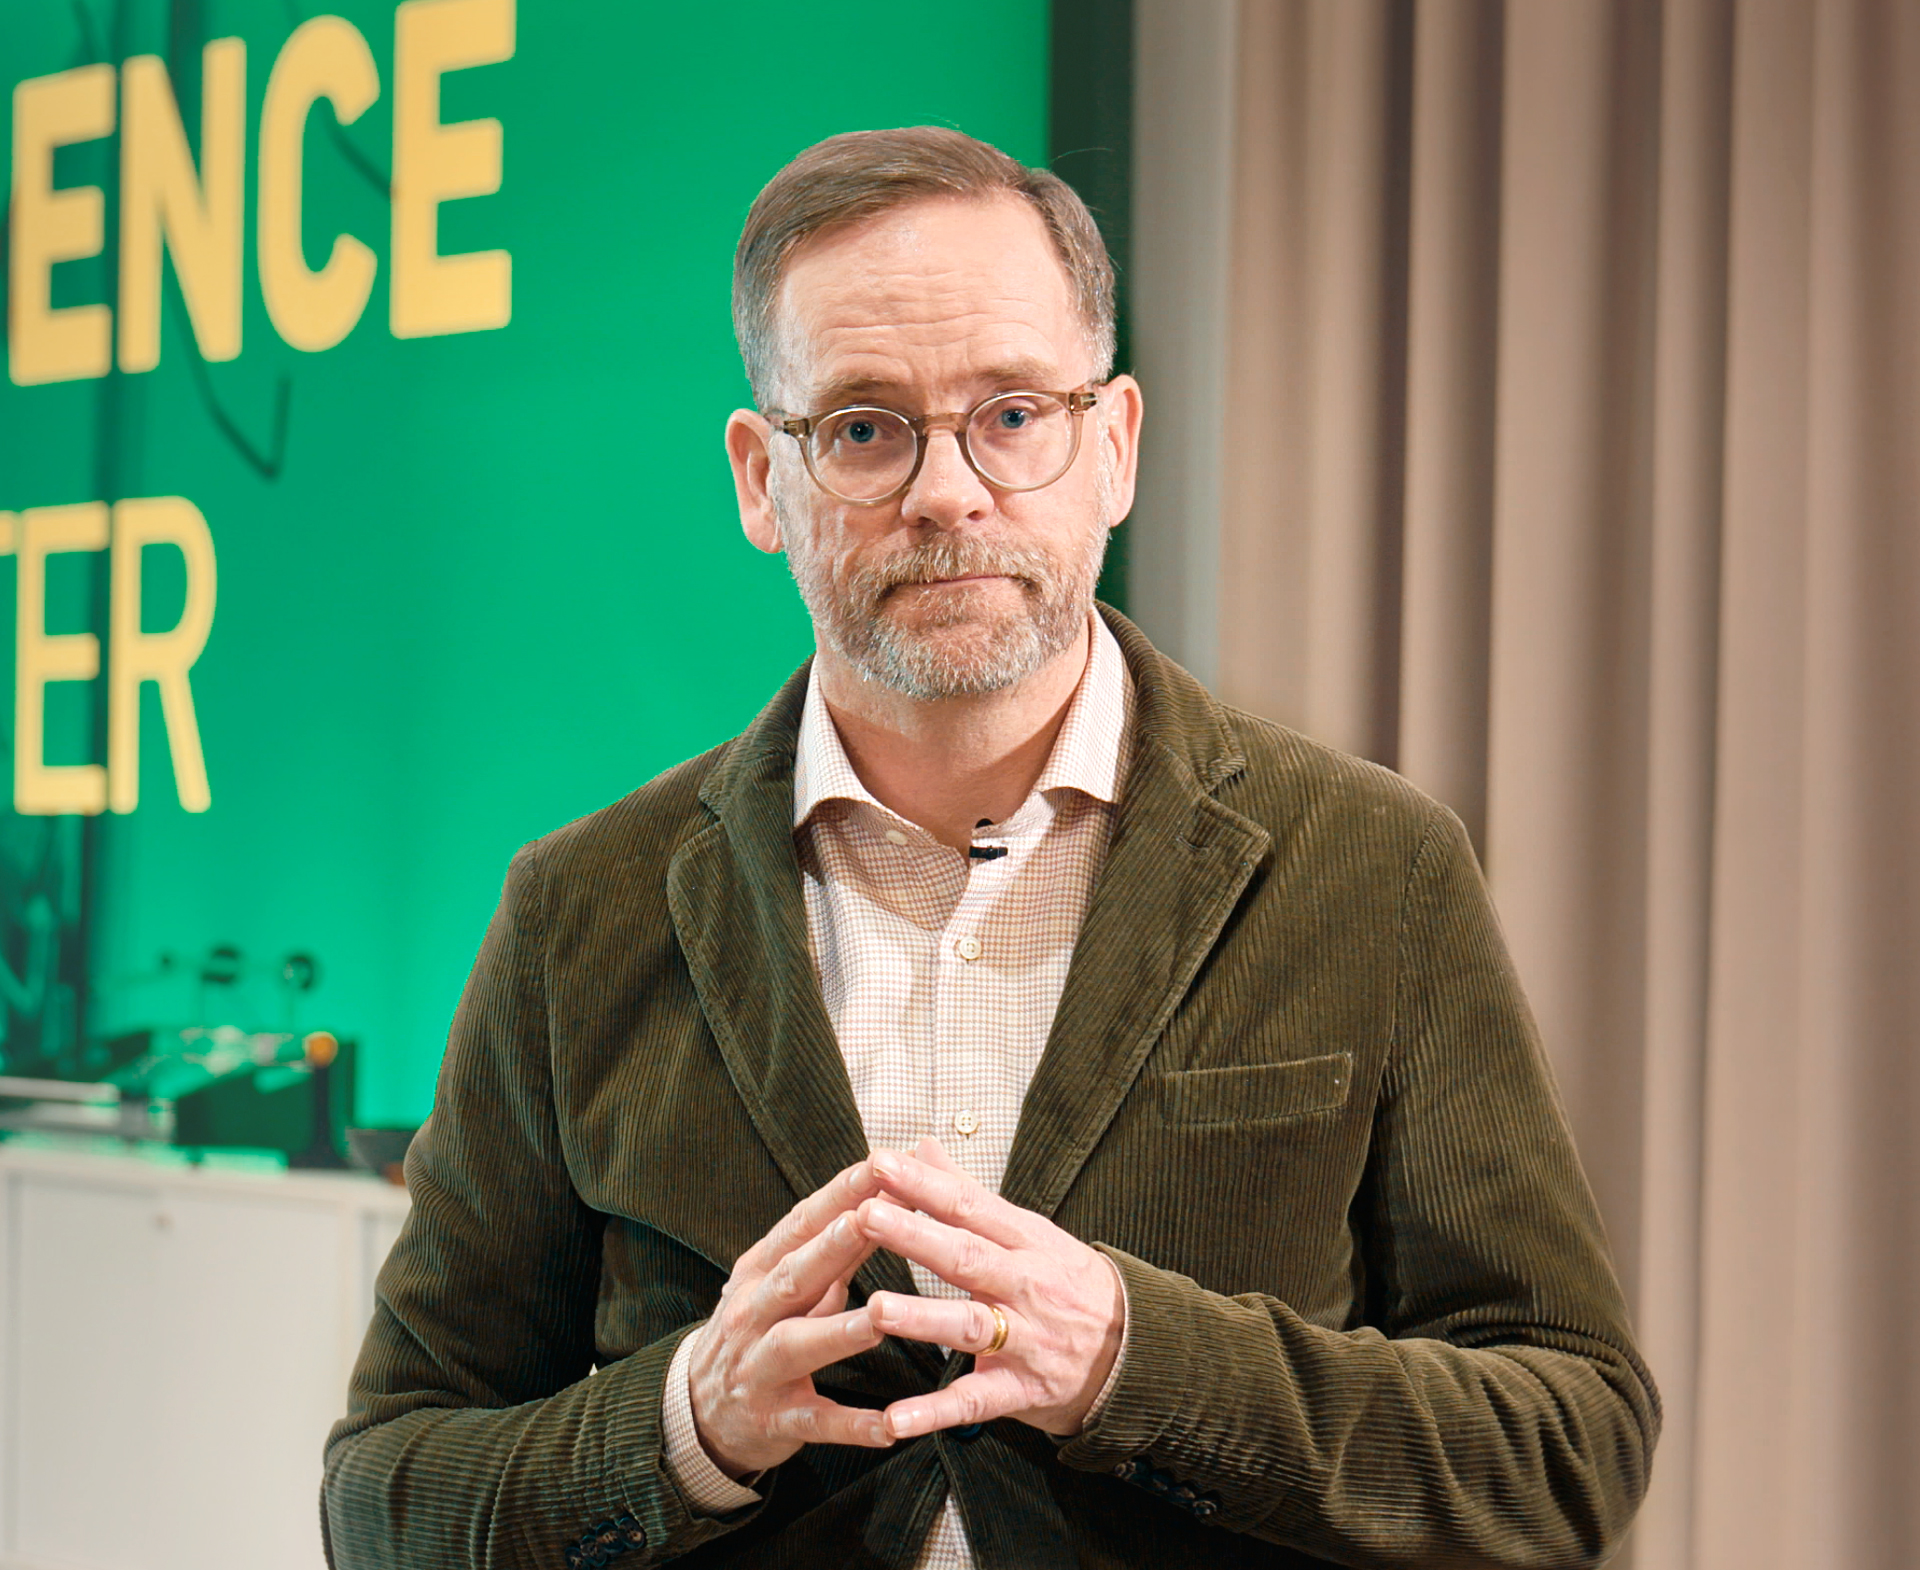
”We see a huge potential to make the coating industry greener – by filling the lines and helping our costumers become more efficient”
– Petter Törefors, CEO, HangOn
What would the results be in your coating production? Find out with the HangOn Calculator!
Calculate your savingsDid you know that the major part of your energy usage is constant – regardless of the amount of goods coated? This means that by coating more objects per hour, you get a lower energy usage per object.
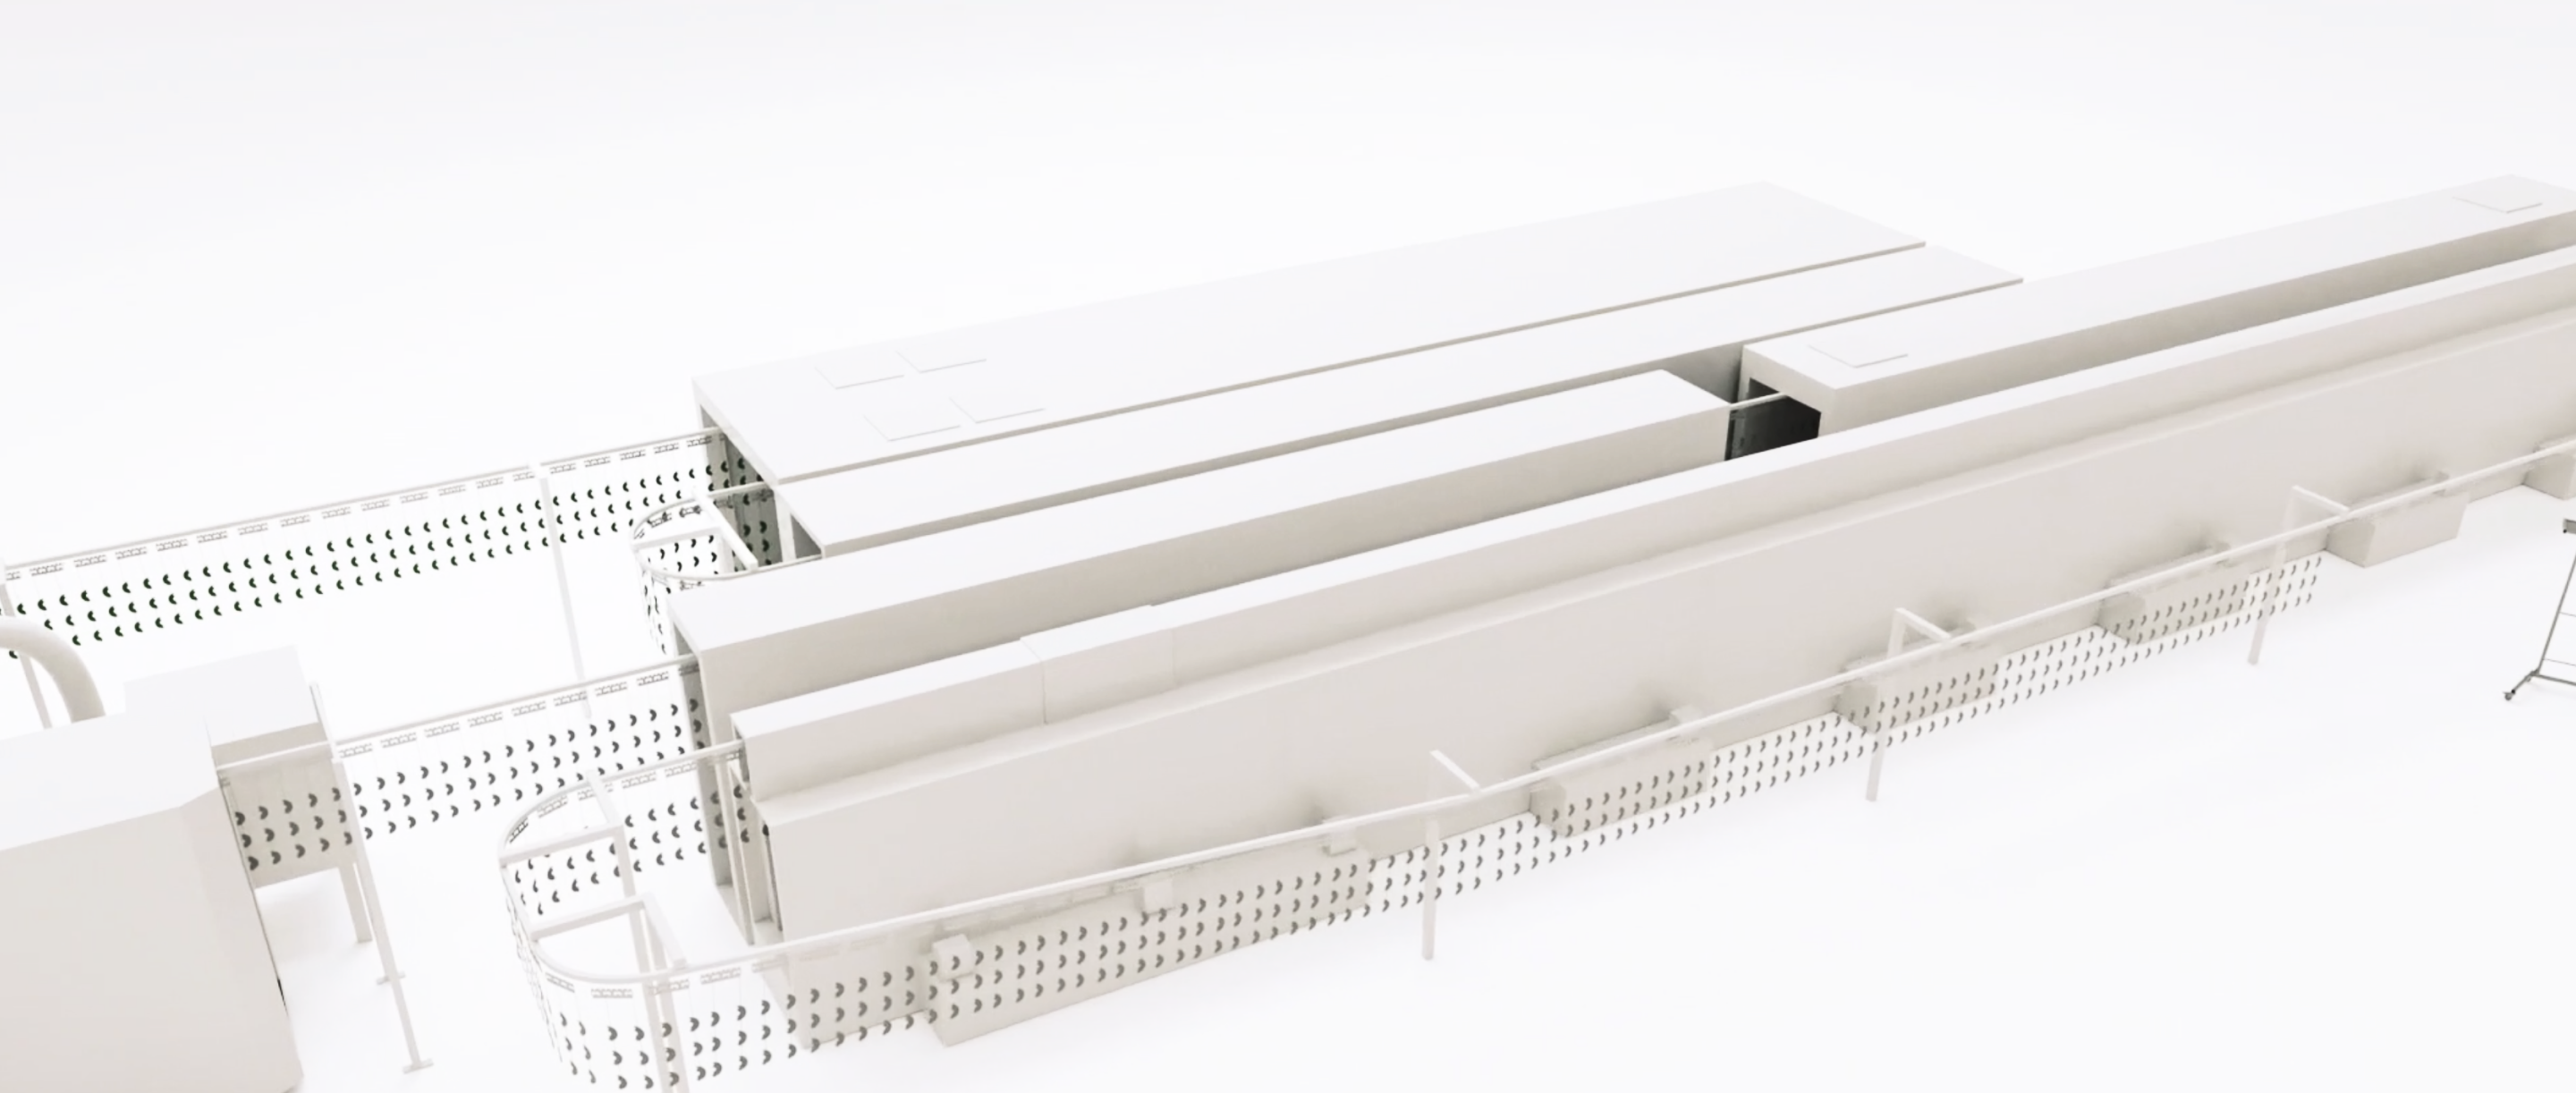
Energy consumption in a coating line
- Conveyor speed 2m/min
- Conveyer length 293 m
- Object size (LxWxH): 3000x600x1500 mm
3 big energy losses
One of the reasons why the energy consumption in a coating line is constant, regardless of how many objects are being coated, is energy losses. 3 of the biggest areas where losses tend to happen, is through outer surfaces, ventilation and heat leakage trough openings.
Radiation
Ventilation
Heat leakage
0,55
kWh per coated object
0,33
kWh per coated object
440
kWh
- Pretreatment
- Drying oven
- Curing oven
- Powder box
- Savings
40 %
energy savings per coated object

442
kWh
”Dense hanging used together with lower conveyor speed is the best way to save energy as it enables lower temperatures in the ovens”
– Anders Jansson, Meyer & Hjort AB
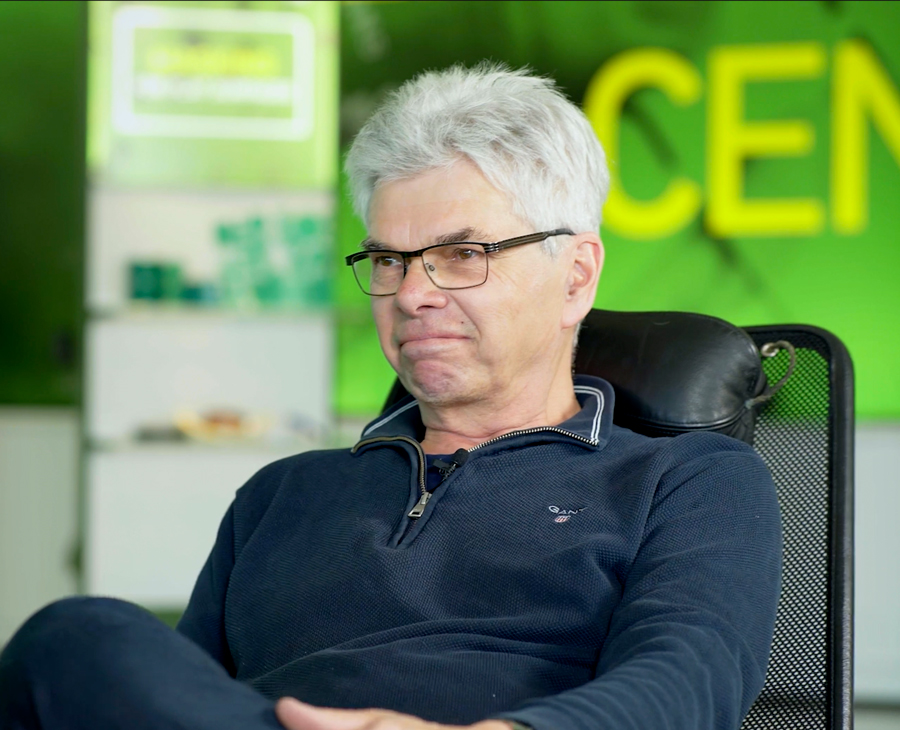
Anders explains!
Energy consumption in the different parts of a coating line

Powder application

Cooling zones

Curing oven

Pretreatment

Conveyor
Did you know that you can also auto translate the videos into your language?
Watch tutorial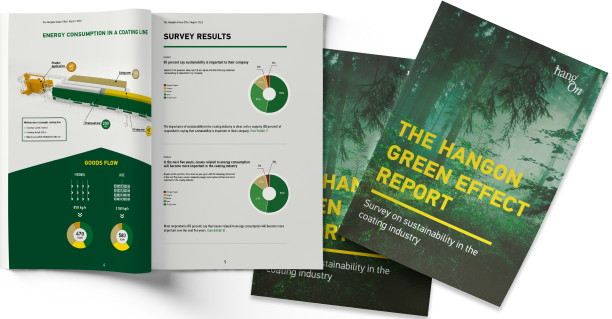
How much could you lower your energy consumption? Find out with the HangOn Calculator!
Calculate your savingsSustainability and climate change in the coating industry
Sustainability is high on the agenda in the world today and is typically defined as a balance between the three areas Environment, Social & Governance (ESG). In the environment area there are several big challenges, one of which is climate change through emissions of green house gases. How will this impact the coating industry?
Global political initiatives
It is international scientific consensus that, in order to prevent the worst climate damages, global net human-caused emissions of carbon dioxide (CO2) needs to reach net zero around 2050.The majority of actions by national governments to cut greenhouse gases and fight climate change revolve around the 2016 Paris Agreement, in which 196 countries pledged to reduce greenhouse gas emissions with their own specific goals by the year 2030.
Within the EU, this has been manifested politically by EU’s Green Deal in order to make Europe the first climate neutral region by 2050. There are several actions launched to achieve this and one of the latest is CSRD,... Read more!
Meet one of our industry leaders in sustainability – Proton!
How did they do it? Deep dive into Proton’s sustainability project
”Climate change is our biggest sustainability challenge”
– Maria Thom, Sustainability Manager, Proton
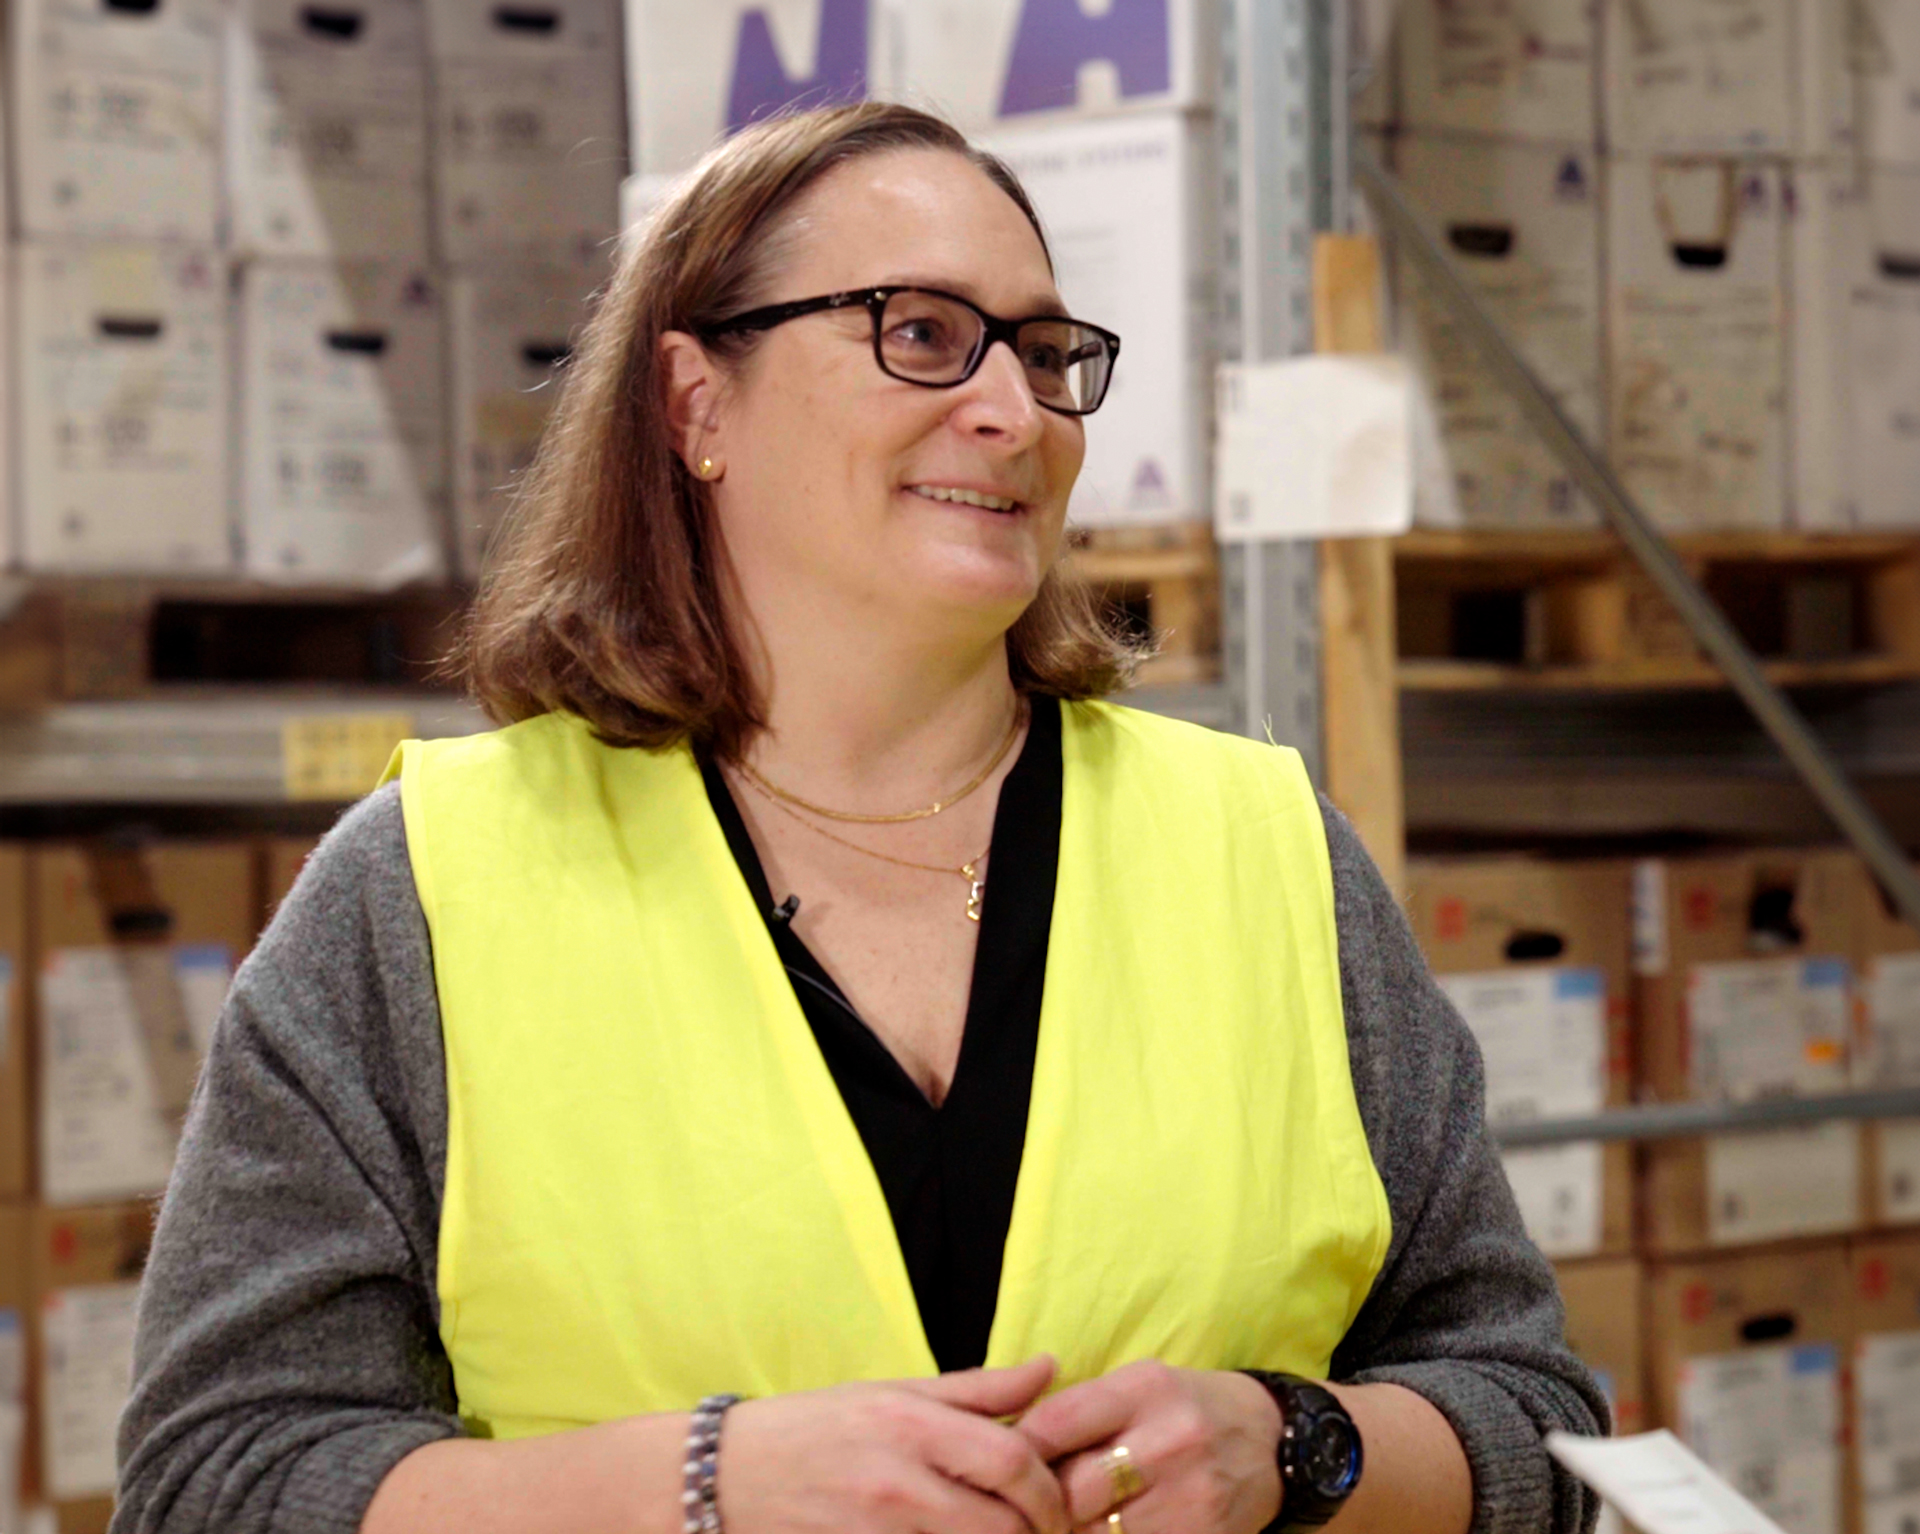
Go into detail with Maria – check out the full video!
Go to the full videoWhat affects the CO2 values in a coating process?
Coating line
CO2 emissions arise from the energy consumption in a coating line. The source can be electrical or a combination of electrical and gas, oil or LPG. Which combination you have, and how the energy is produced, will make a big difference. Coal powered electricity for instance, has over 30 times higher CO2 emissions than hydro powered electricity.
Powder
The powder can actually make a big difference in your CO2 footprint. The CO2 emissions arise mainly from raw material and during the production of the powder, but coating thickness and powder utilization are also important factors.
Hanging solution
When it comes to hooks and other hanging solutions, the main source of CO2 emissions comes from the steel material production. The production of the hanger itself typically stands for a smaller part. A hanging solution with higher hanging density reduces the CO2 emissions from both the coating line and powder – a reduction that is much larger than the emissions it caused while being produced.
198 g
CO2 per coated object
128 g
CO2 per coated object
- Coating Process
- Powder
- Hanger
- Savings
36 %
CO2 savings

Get your CO2 footprint
in 3 simple steps!
The cost structure for an automatic powder coating line is to a large extent fixed or semi fixed – around 80% according to our calculations. Increasing your efficiency by filling the line and coating more objects per hour, is therefore a very effective way to both lower cost and increase profit!
20% variable costs
50% fixed costs
30% semi-fixed costs
0,45
Euro per coated object
0,31
Euro per coated object
- Fixed line
- Energy
- Blue Collar
- Powder
- Hanging Point
- Savings
32 %
cost savings

How to save money in your coating line
- Use our HangOn Calculator to understand the energy consumption and cost structure in your line
- Make hanging a strategic issue, as it has a great impact on the line utilization and working methods. Don’t forget: it is a management question
- Simplify and focus on volume products to improve the line density (pareto 80/20 rule)
- Elaborate working methods. For example: maximize the amount of products per conveyor meter with a denser hanging solution, preferably one with prehanging. The saved time can close shifts or allow a production free day for maintenance etc – which saves energy costs!
- Keep in mind that you can halve your hanging time by using effective hanging solutions – this too, has a big cost saving effect!
- Get in touch with us for personal advice, or help to find the best solution for your line
”HangOn’s creative solutions helped us take our coating process and capacity utilization to a new level”
– Fredrik Herskind, Production Manager, Skeppshult
Watch their case video hereHow much could you save? Find out right now with the HangOn Calculator!
Calculate your savingsFill the line
by HangOn
Efficiency is key – but how can we measure efficiency? Our first tip is not to get stuck on line speed. Look at OEE, the 6 big losses and the one thing you can affect the most: hanging density. It’s easier than it might sound. Keep scrolling and we’ll guide you trough it.
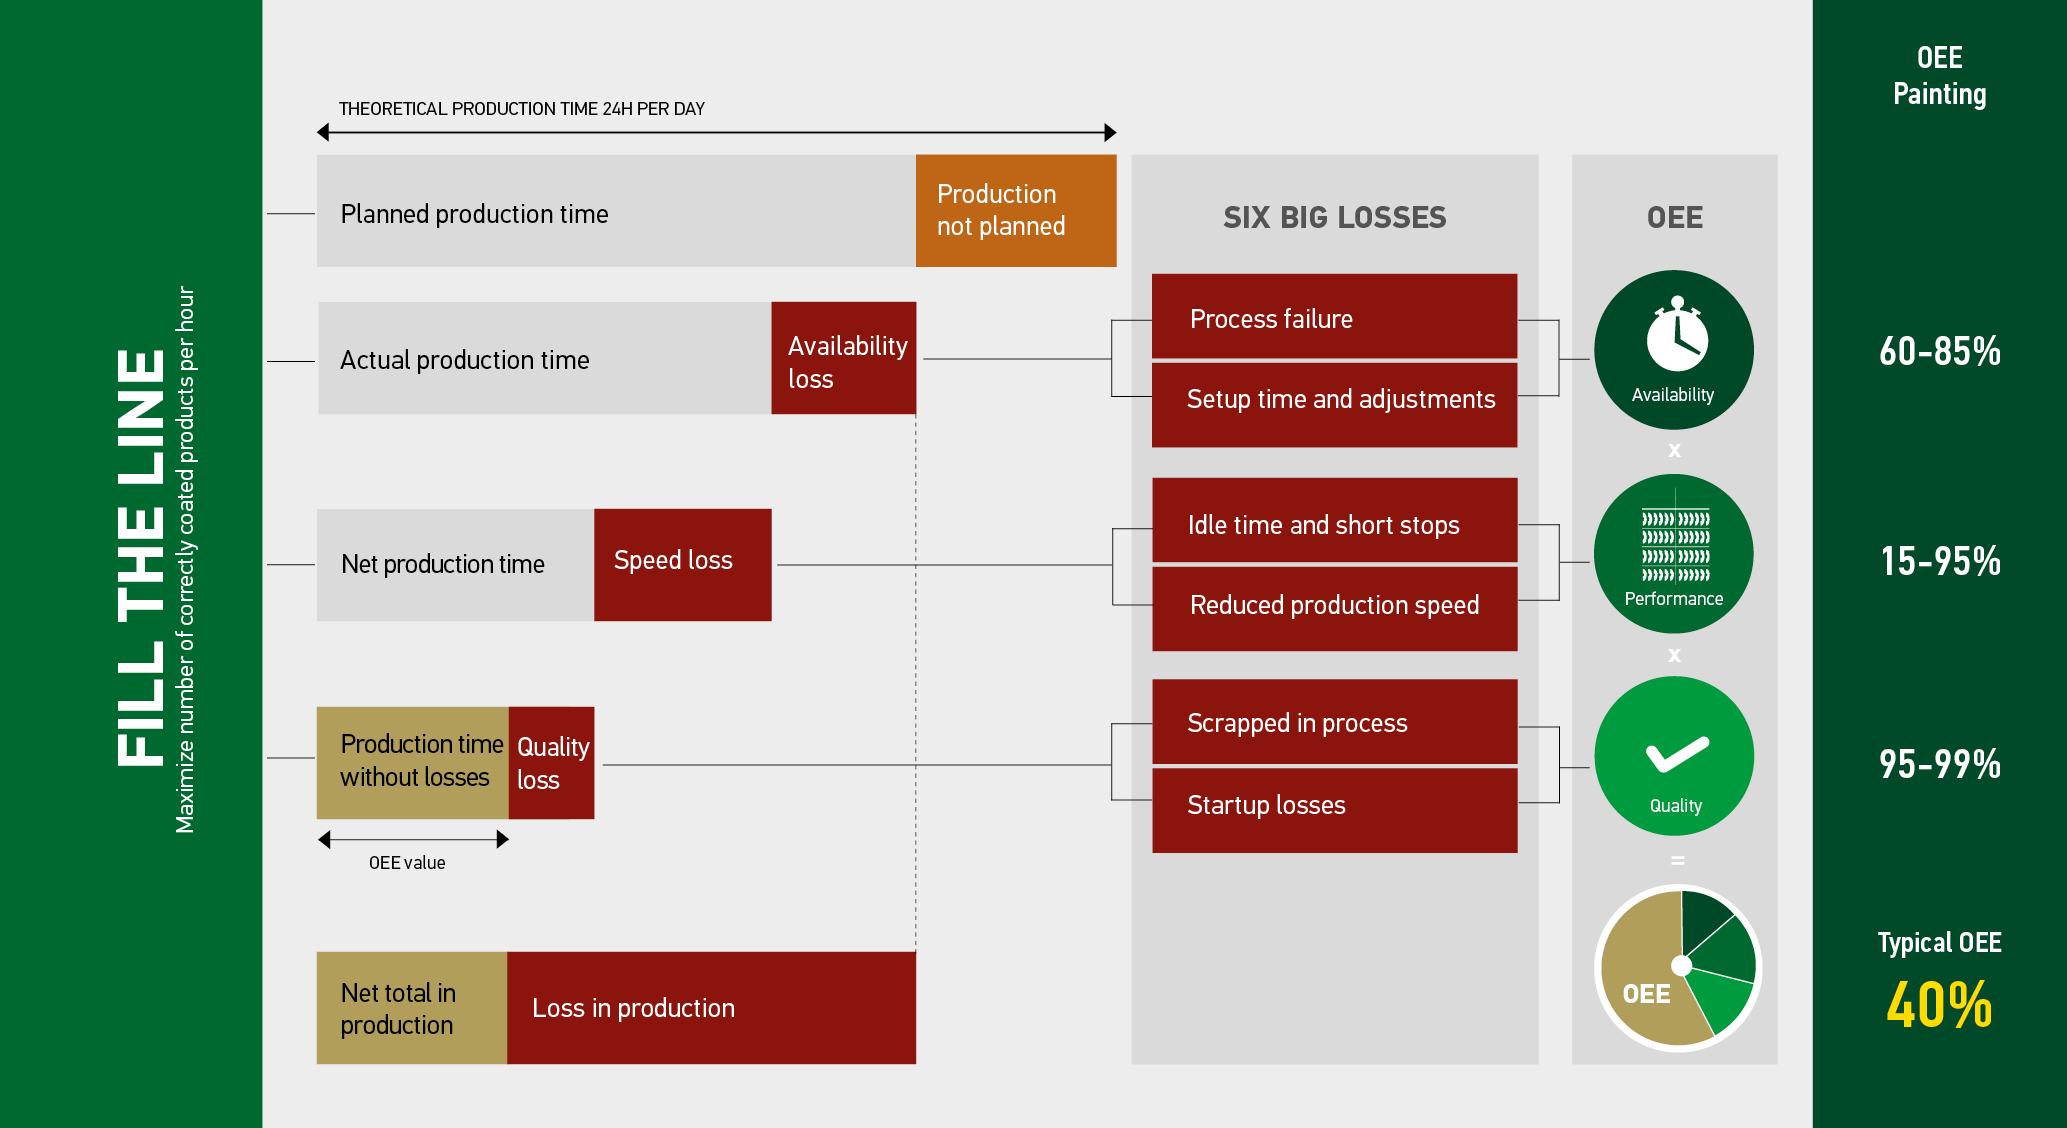
Do what Proton, Skeppshult and 4,500 of our clients have already done – Fill the line!
Fill the line – and achieve all 3 effects
Lower Energy
Lower CO2
Higher Profit